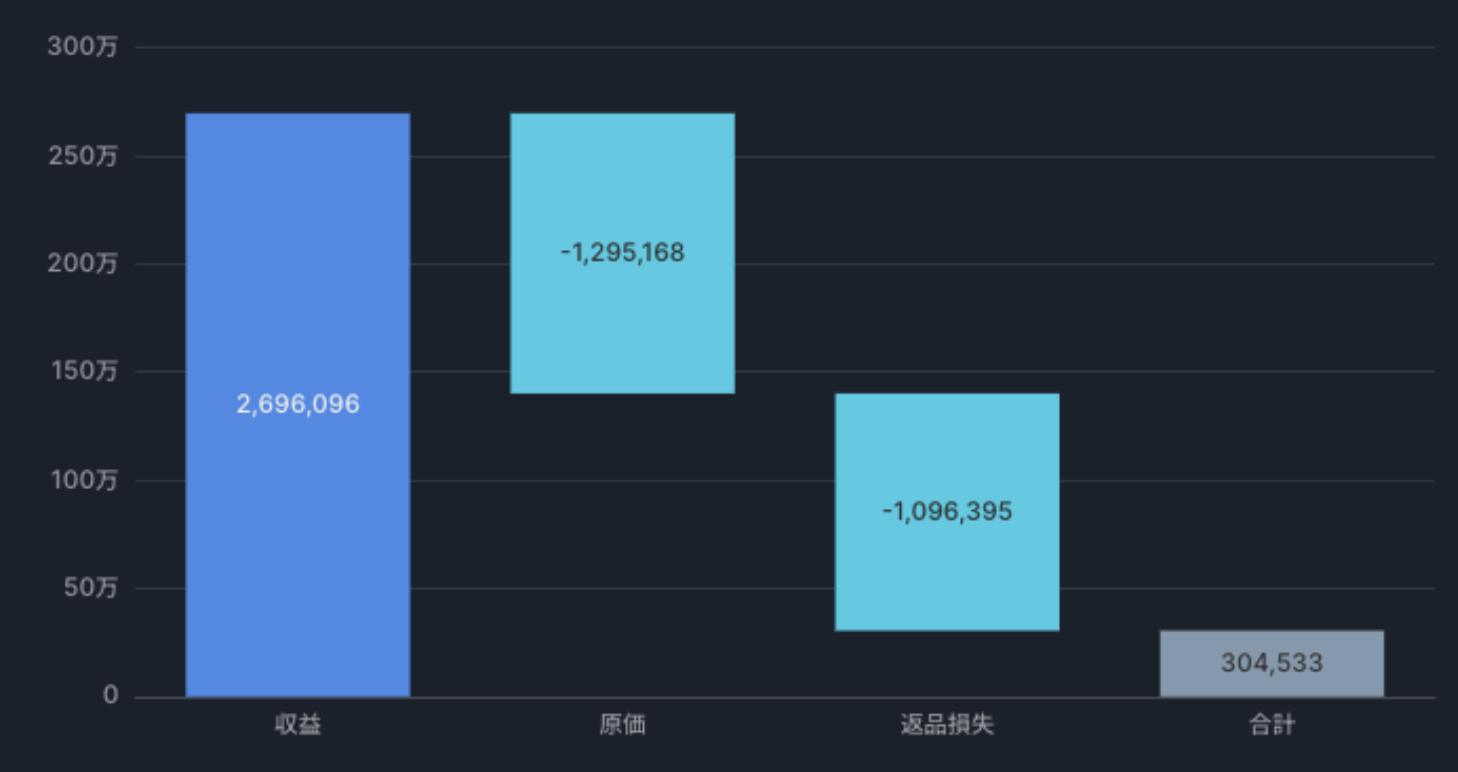
Waterfall Chart is Now Available
We've added a new Waterfall Chart to help you visually represent step-by-step increases and decreases in your data. You can now intuitively track cumulative changes driven by multiple factors — such as revenue, expenses, and balances — making financial analysis and variance analysis easier than ever. Give it a try!
Key Features
Step-by-step visualization
: Increases and decreases at each step are color-coded, giving you an at-a-glance view of the overall flow
Flexible label configuration
: Specify a dimension column to freely define the stages and categories you want to analyze
Cumulative value display
: Track the running total at each stage, from starting value to final result
Use Cases
P&L analysis
: Clearly show the flow from opening balance through revenue, expenses, and other changes to the closing balance
Cash flow visualization
: Break down cash inflows and outflows by factor to understand how funds moved over a period
Budget vs. actuals
: Highlight the sources of variance step by step to pinpoint the root causes of discrepancies
For setup details and more, please refer to our support documentation.
Specifications are subject to change without notice.
We hope this helps take your data analysis to the next level!
We'd love to hear your feedback and feature requests.