Templates
An overview of Codatum's features and data analysis case studies.
Learn and apply key data analysis concepts.
Learn Explore the diverse features of Codatum
Notebook Introduction
Learn the basics of using notebooks

Data Explorer
Field stats and Explorer to explore large data
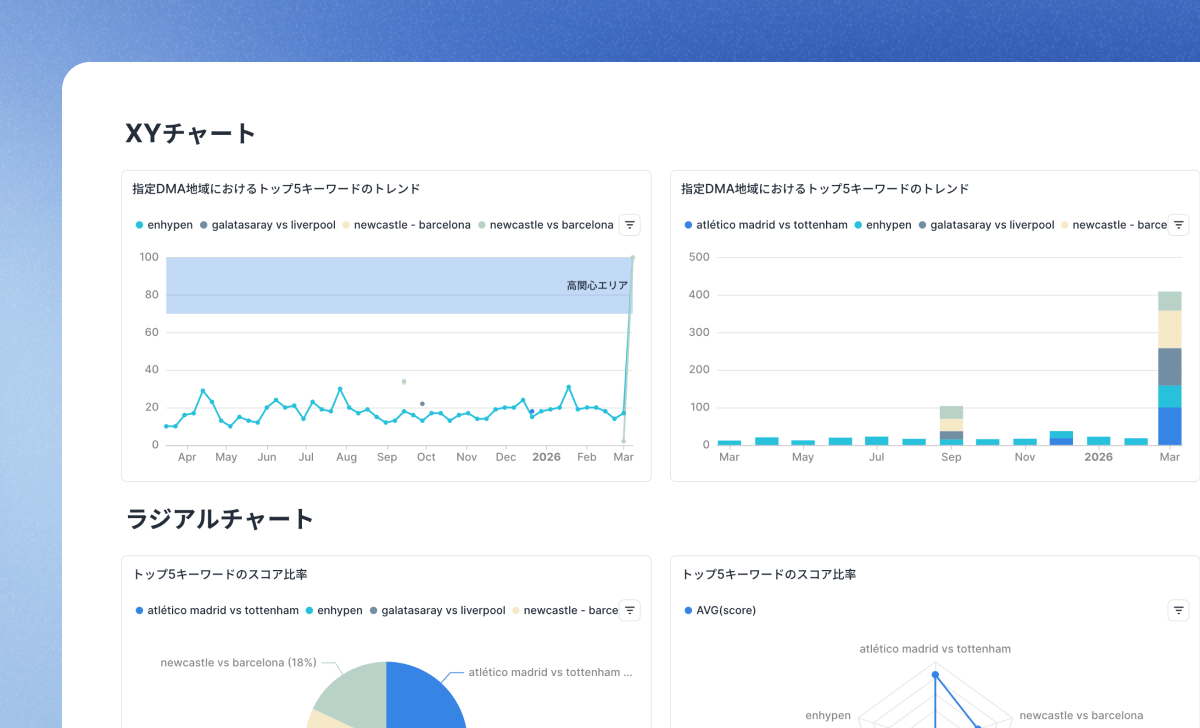
Charts Gallery
A wide variety of charts for visualizing data
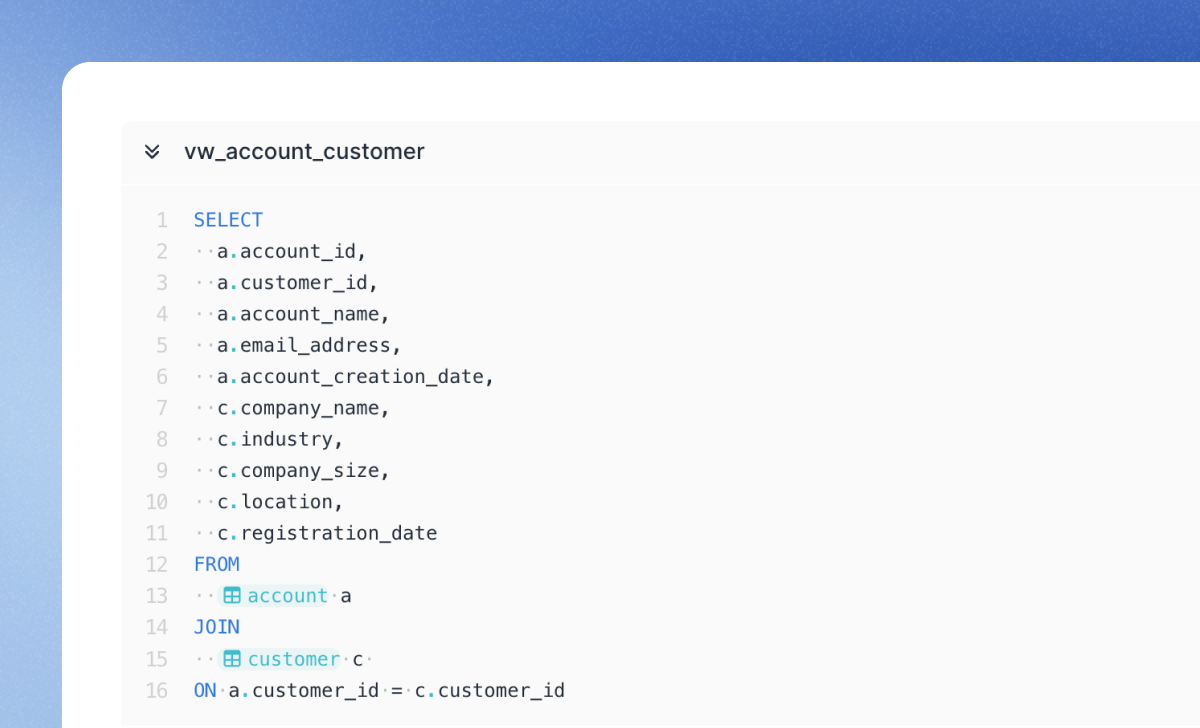
Table overview and useful queries
This Notebook provides a clear overview of key tables, their relationships, and useful SQL queries for efficient data analysis
Use cases Explore practical applications from case studies
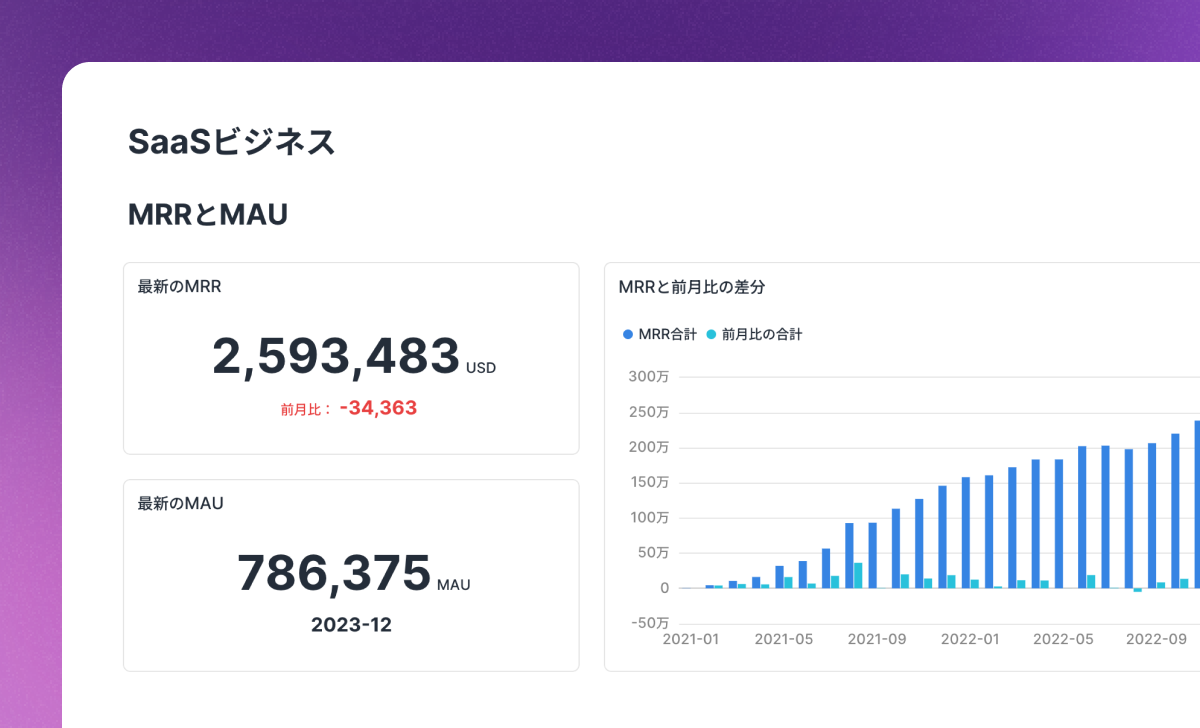
SaaS Business KPIs
This SaaS dashboard tracks MRR, MAU, and support metrics by industry and company size, highlighting growth
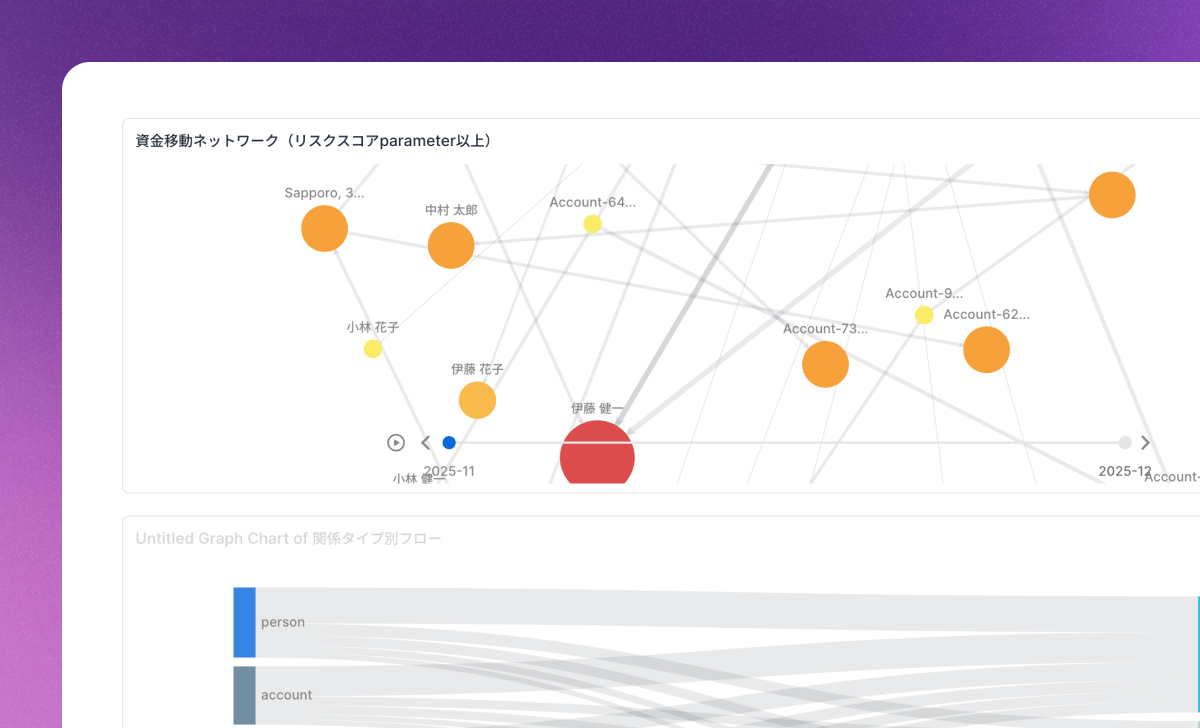
Risk Network Monitoring
This dashboard centralizes alerts detected by the fraud detection system and the status of related cases.
Delivery Performance
This dashboard is designed to centrally manage delivery performance for your e-commerce business
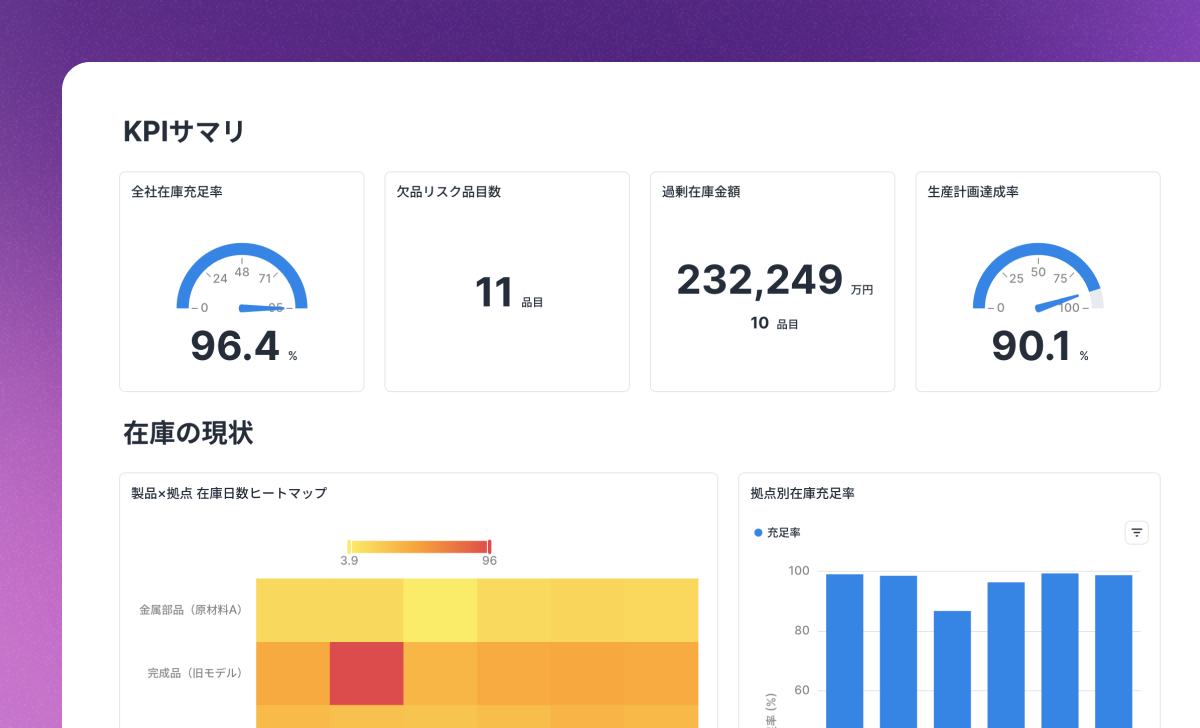
Manufacturing & Inventory Management Dashboard
A dashboard for factory managers, inventory planners, and procurement managers to monitor stock levels by location, identify shortage and overstock risks, and track production plan achievement at a glance.
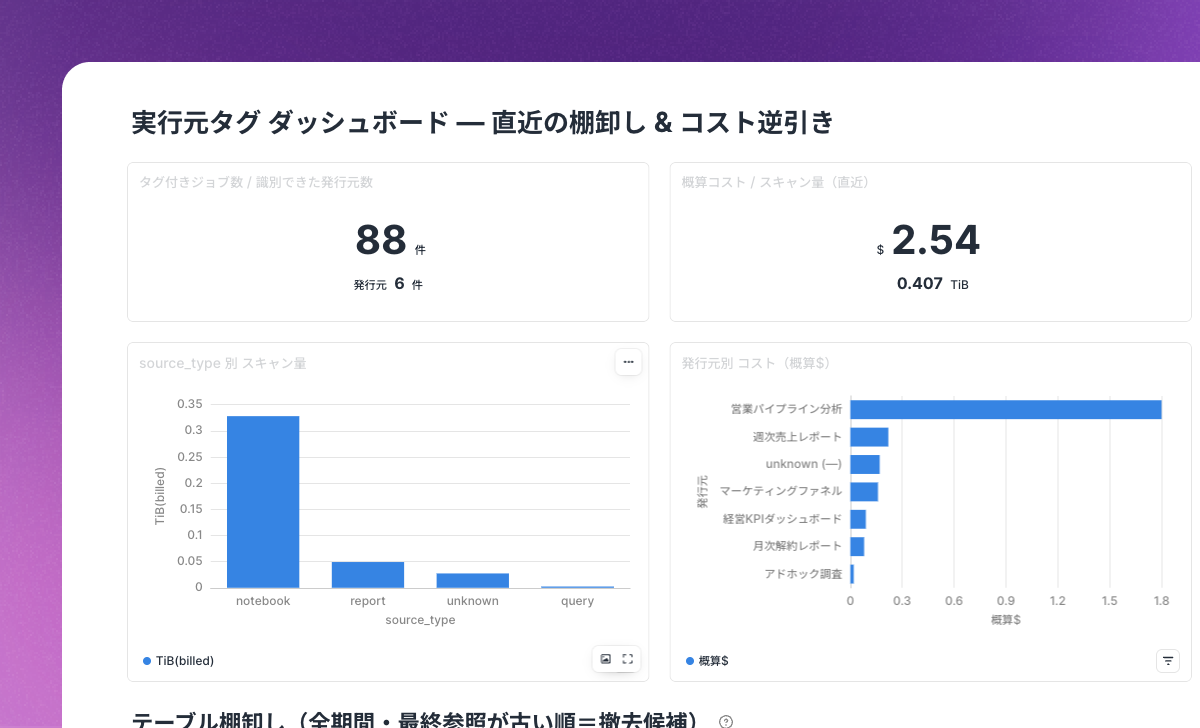
BigQuery Table Inventory & Cost by Query Tags
A BigQuery dashboard that joins Codatum's query execution tags (cdm_* labels) with INFORMATION_SCHEMA.JOBS to inventory which notebooks and reports reference each table, and to trace query cost back to its source.
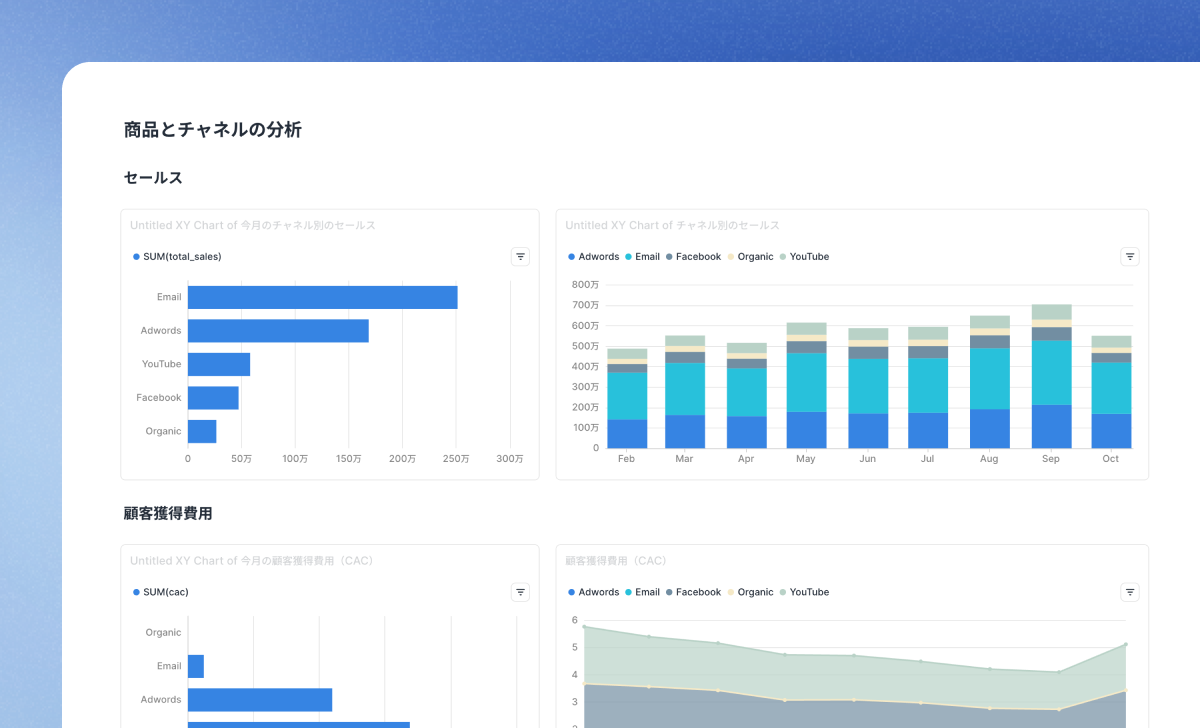
E-Commerce Monthly KPI Dashboard
This e-commerce dashboard offers key performance insights, including product and channel analysis, in a concise format
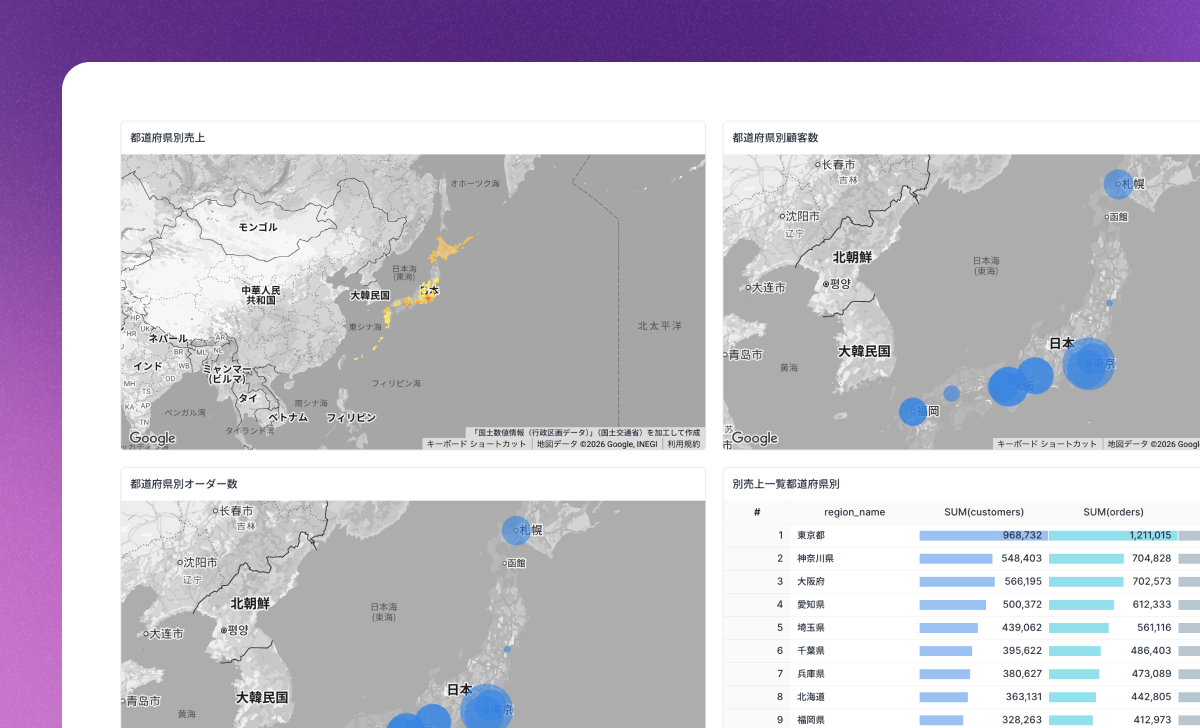
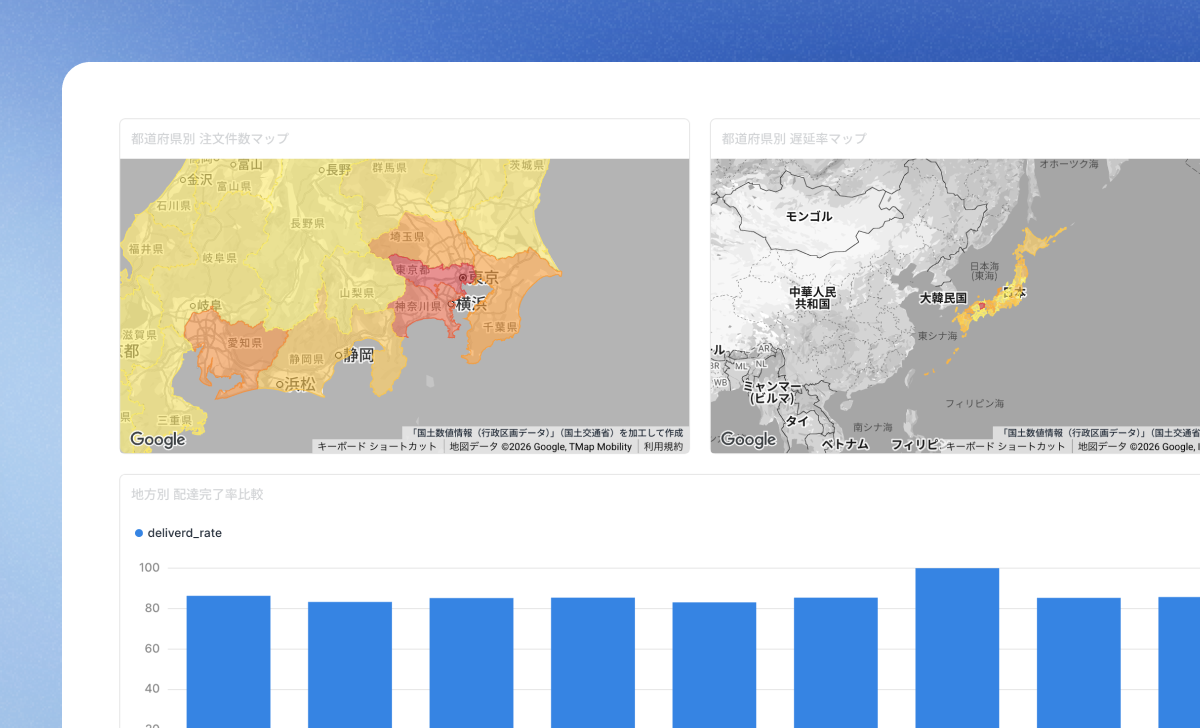
Mapping regional distribution
This dashboard visualizes data such as sales, customers, and orders on a map, enabling you to intuitively understand regional biases and trends by area.
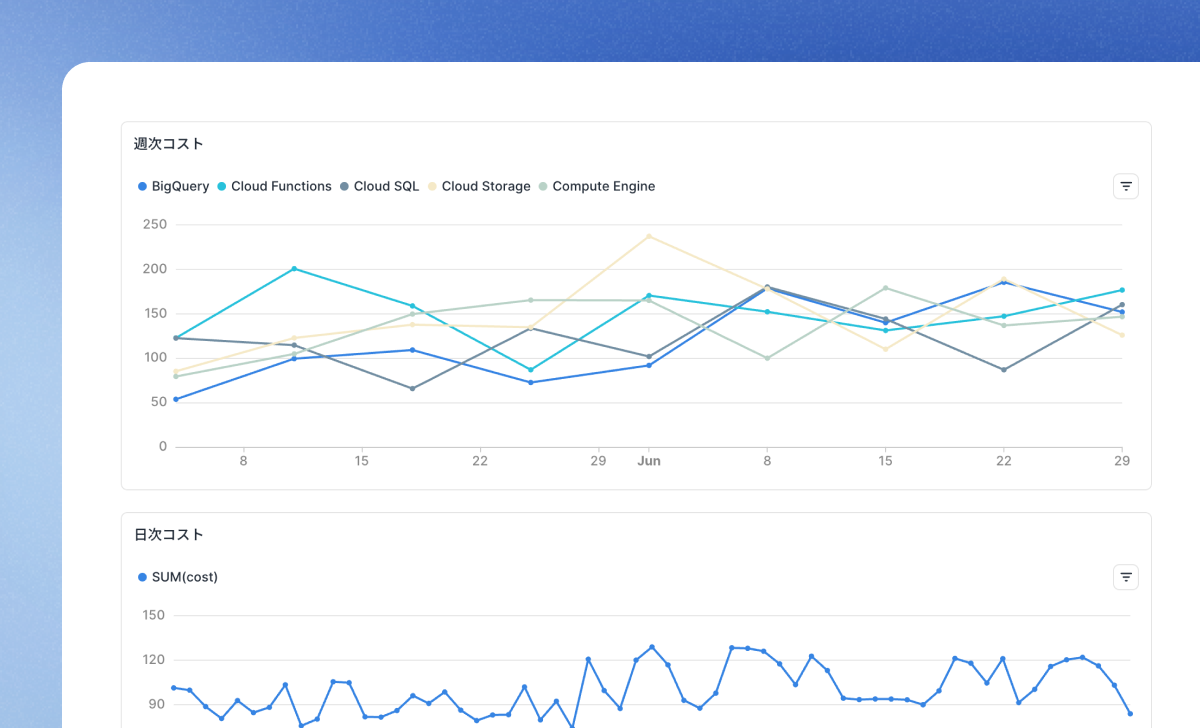
Google cloud Cost Analysis
This Notebook documents our weekly Google cloud cost review, outlining key metrics, trends, and action items
Customer Success Dashboard
This dashboard gives you a quick view of each customer's usage and results. With contract details and benchmark comparisons, you can easily prioritize and plan your customer success efforts.
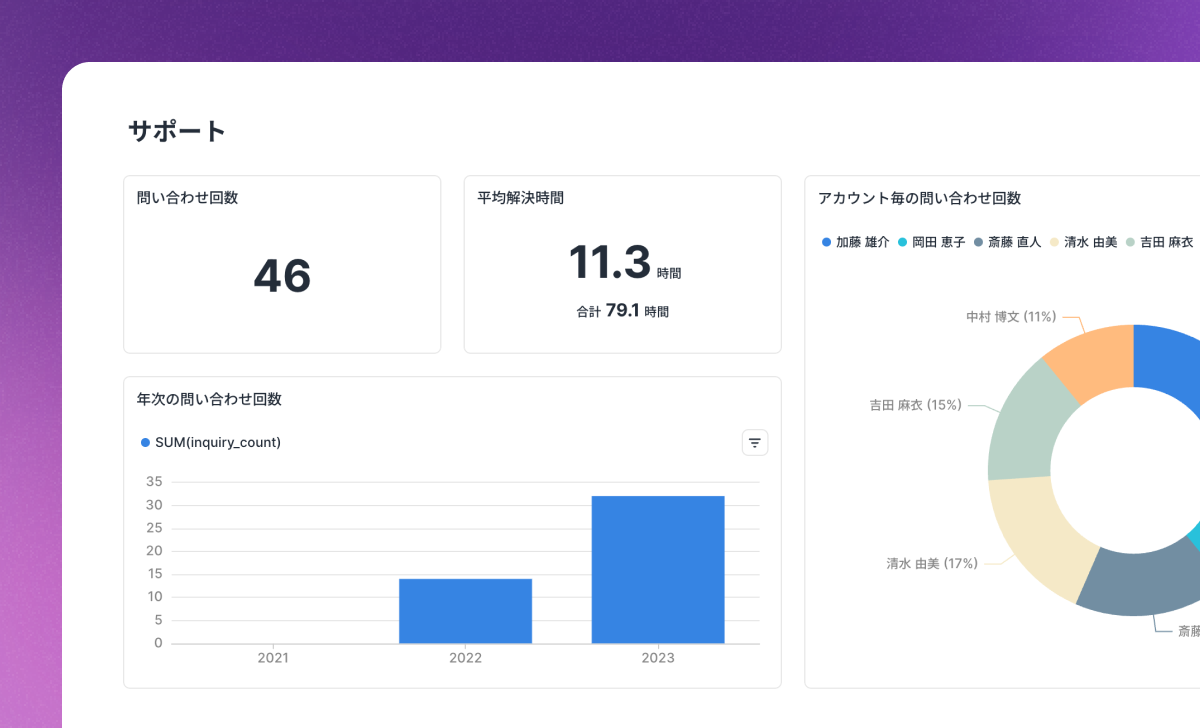
Detailed Customer Dashboard
This customer dashboard offers insights into account details, usage metrics, support inquiries, and contract information
External Service Integrations Learn practical analysis methods with templates using external data sources
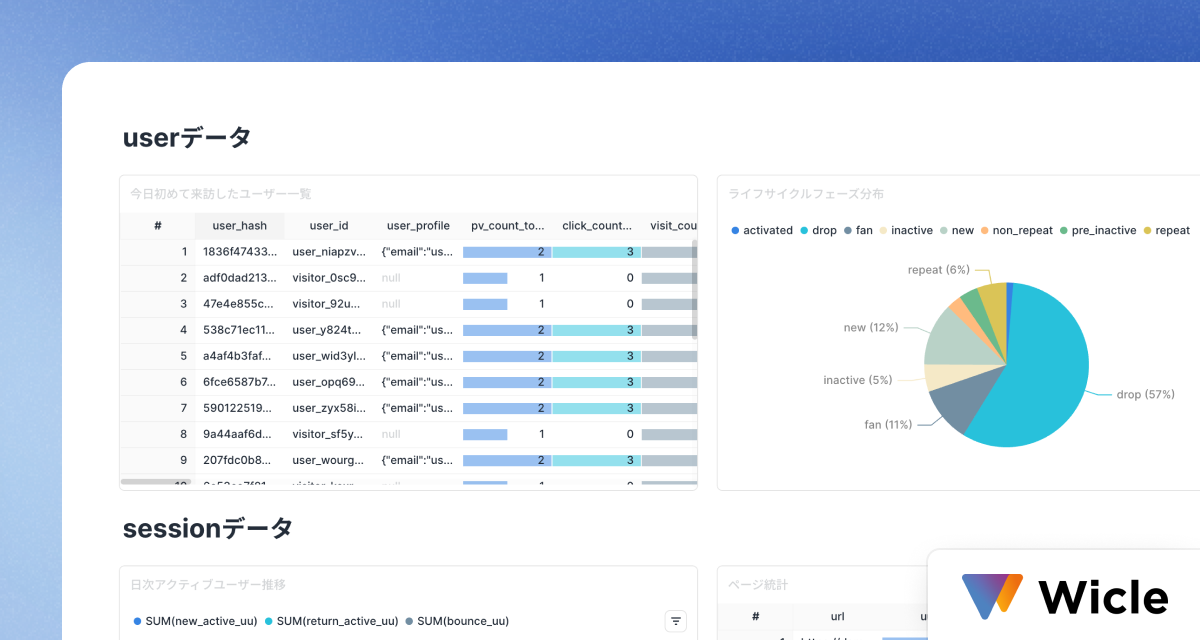
User Behavior Analysis by Wicle
Analyze user behavior on websites using data from Wicle
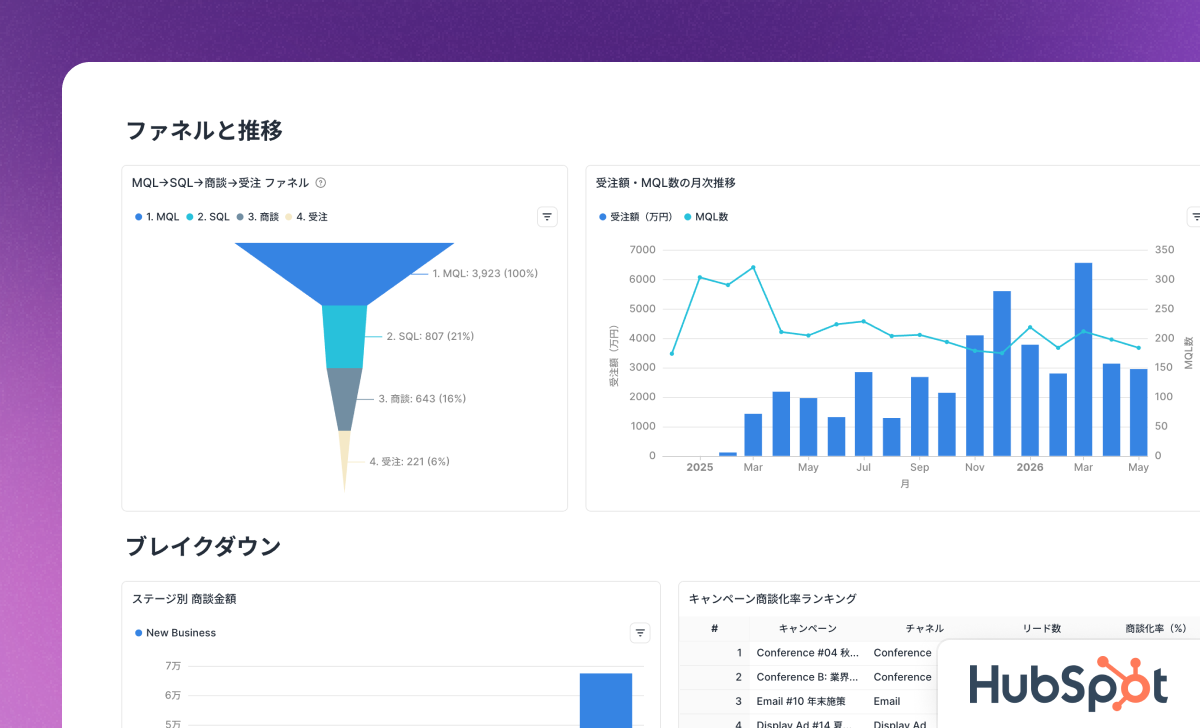
HubSpot Sales & Marketing Dashboard
A single dashboard spanning HubSpot deals, contacts, and campaigns to track pipeline health, marketing contribution, and SDR/AE activity at a glance.
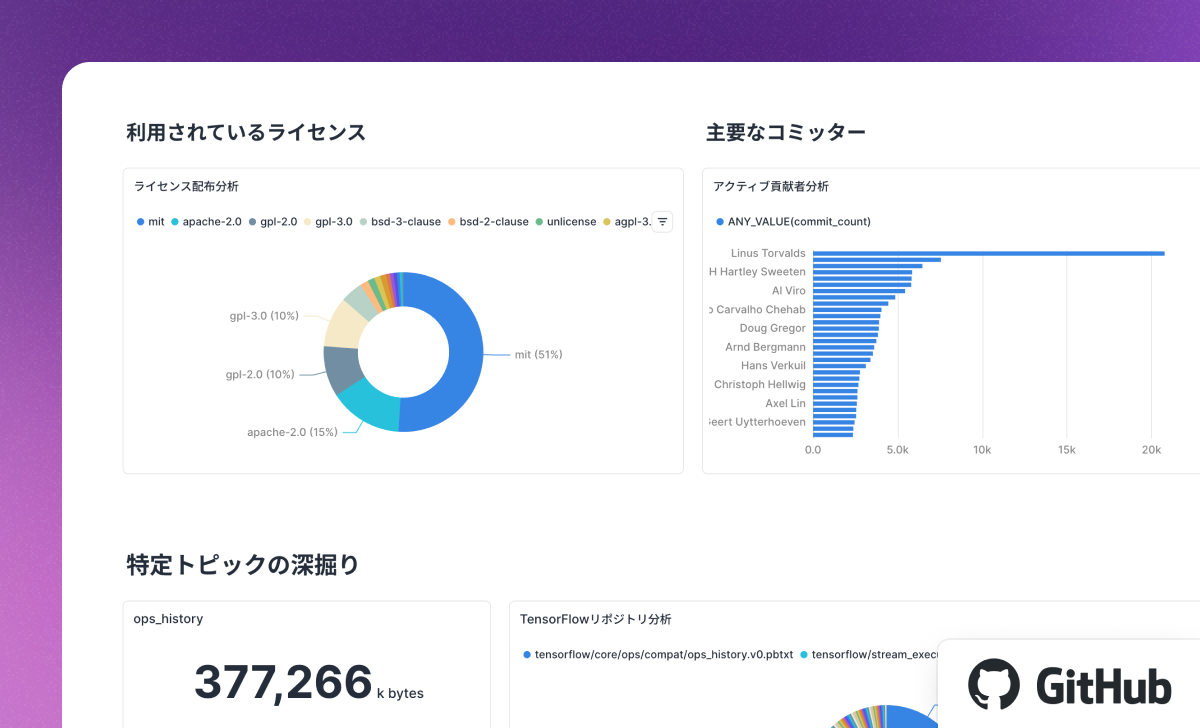
Programming Trends in Open-Source Files
A case study of analyzing programming trends based on publicly available data from Github and how it can be used for SaaS
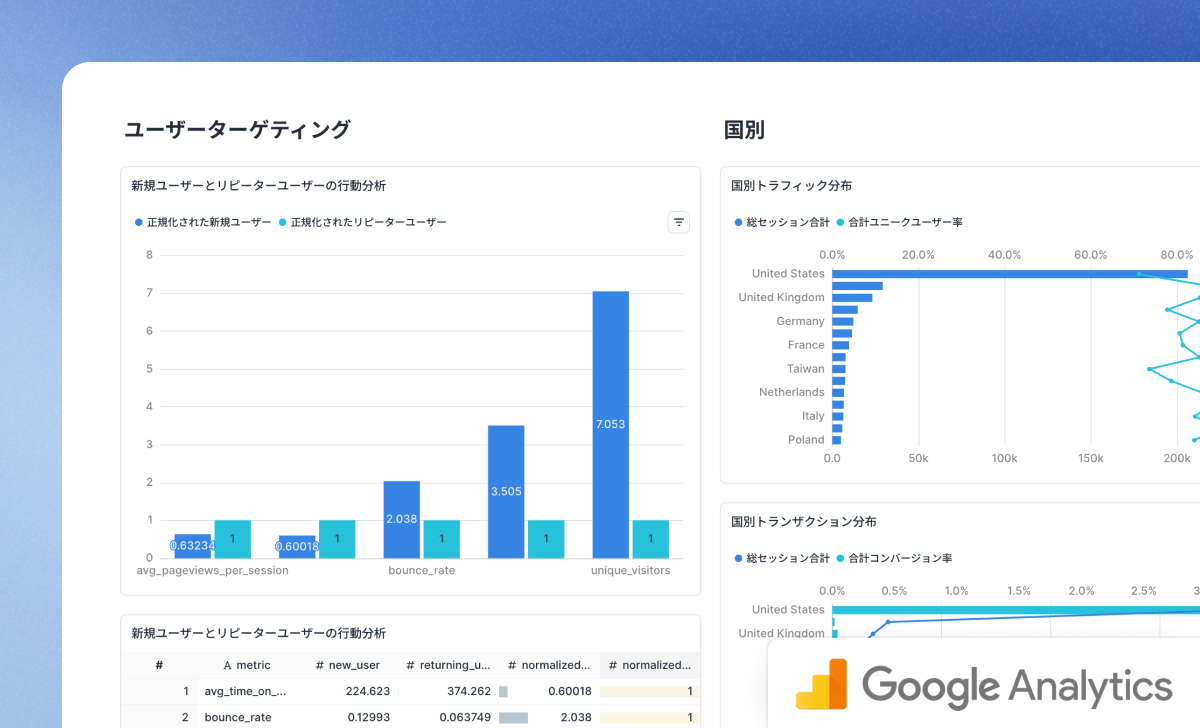
UX in E-Commerce
A case study of analyzing UX based on publicly available data from Google Analytics and considering how to use it for e-commerce
Start using
Codatum for free
Unlock the potential of your data
with Codatum
No credit card required