"Split by Series" Added to XY Chart
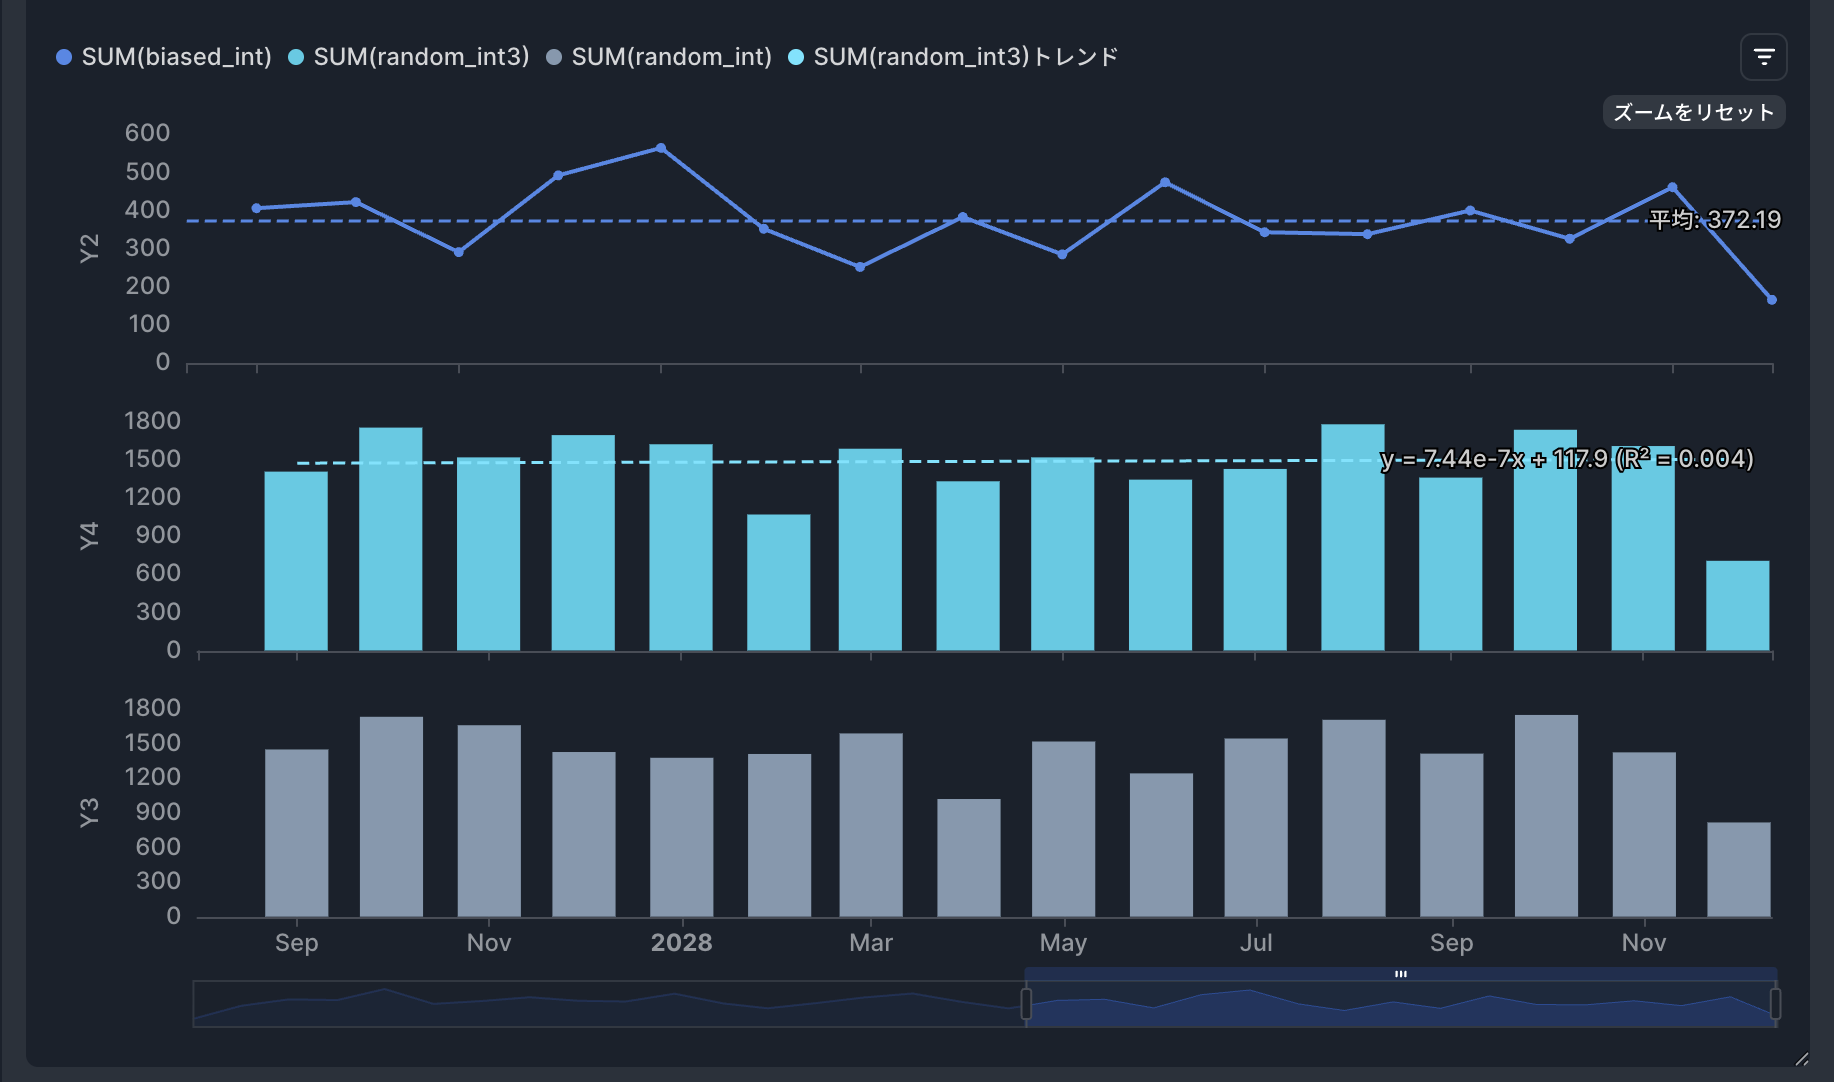
You can now split XY charts into separate vertical panels per series when multiple series are configured. Each panel uses its own independent Y-axis scale, making it easy to compare metrics with different units or vastly different value ranges side by side.
Highlights
Independent panel per series: When multiple series are defined, a "Split display by series" option becomes available. Enabling it arranges each series in its own vertical panel with an independent Y-axis, so you can read each metric accurately without overlapping scales.
Use Cases
Compare trends of revenue (¥) and conversion rate (%) side by side in a single view
Monitor KPIs across multiple products or channels in aligned panels
Visualize absolute values alongside ratios where scale differences would otherwise distort the chart
For setup details, see the support documentation.
Specifications are subject to change without notice.
We hope this helps you get more out of your data analysis!
We'd love to hear your thoughts and feedback on this feature.